Reports Primer
Welcome to paeducationquality.net’s tabulation of Pennsylvania System of Student Assessment (PSSA) scores which was part of our larger project for the Pennsylvania State Board of Education. School by school tabulations of the kind shown below are scheduled for release later this year.
Under signed confidentiality agreements, the research project for the Pennsylvania State Board of Education at Carnegie Mellon’s H. John Heinz III School of Public Policy & Management obtained from the Pennsylvania Department of Education (PDE) individual student level PSSA results for school years 1995-6 through 2003-4. The project has also obtained under signed confidentiality agreements from Data Recognition Corporation (DRC), which constructs the PSSA tests, individual student level PSSA results for school years 2004-5 through 2007-8. Initially, the PSSA tests were administered to grades 5, 8, and 11, and more recently, in conjunction with compliance to the federal No Child Left Behind (NCLB) legislation, PSSA tests were administered to grades 3, 4, 5, 6, 7, 8, 9, and 11.
Table 1 displays the entire test matrix administered in Pennsylvania for Reading and Math for the period 1995-6 – 2007-8:
| 1994-5 | 1995-6 | 1996-7 | 1997-8 | 1998-9 | 1999-0 | 2000-1 | 2001-2 | 2002-3 | 2003-4 | 2004-5 | 2005-6 | 2006-7 | 2007-8 | |
|---|---|---|---|---|---|---|---|---|---|---|---|---|---|---|
| Grade 3 | X | X | X | X | X | X | ||||||||
| Grade 4 | X | X | X | |||||||||||
| Grade 5 | X | X | X | X | X | X | X | X | X | X | X | X | X | X |
| Grade 6 | X | X | X | |||||||||||
| Grade 7 | X | X | X | |||||||||||
| Grade 8 | X | X | X | X | X | X | X | X | X | X | X | X | X | X |
| Grade 9 | ||||||||||||||
| Grade 10 | ||||||||||||||
| Grade 11 | X | X | X | X | X | X | X | X | X | X | X | X | X | X |
Because the PSSA tests have different means each year, it is necessary, in order to make comparisons over time, to compare a group result in a given year to a comparison group. Generally, we take the ratio of the group’s mean result to the state wide mean and display the ratio as a percentage. The interpretation then is that the group is achieving on average at that percentage of the state wide average result.
Below we display bar charts of such comparative results in two basic ways:
- Synthetic cohorts of students based on an initial year
- Grade specific results
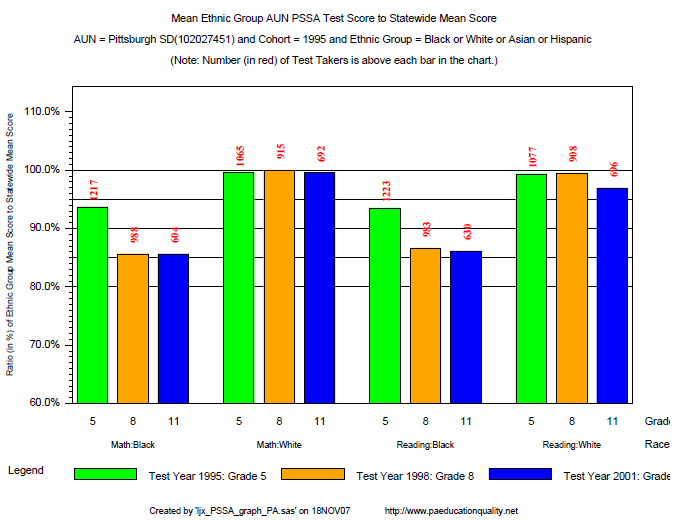
A “synthetic” cohort is formed for a school district by examining the group’s comparative results for a given year, say 5th grade math in 1995, and then showing adjacent to that result, the 8th grade math comparative result three years later or 1998. Finally, we show the 11th grade result for 2001. The cohort is synthetic because it assumes that the students remain in the district and progress one grade per year. For urban districts there is significant mobility of students among districts; however, by using the mean test result for each group compared to the statewide mean, most of this variability is held constant. The sample graph is as follows:

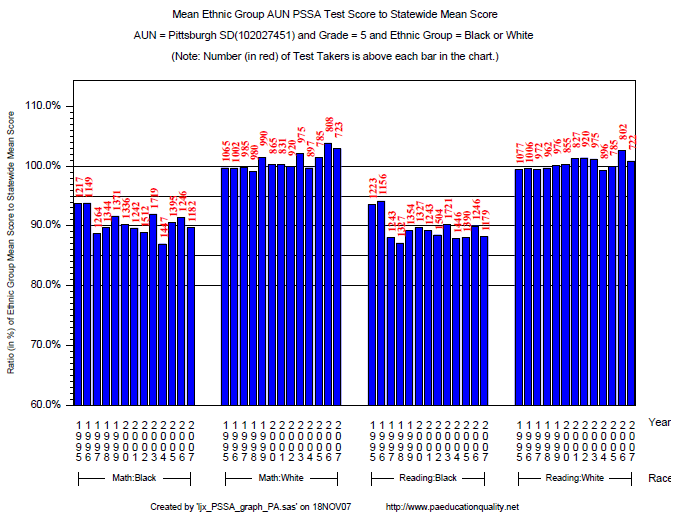
Grade specific results show how a comparison group, say the mean of 8th grade students in a district have done over many years compared to the statewide mean.

In both instances we seek to show results for subgroups and use a rule of 30 students taking a test as our minimum comparison group size.
The bar charts that follow summarize test score results for a group of students by comparing the mean scale score of the group to the state-wide mean for a year, grade and test (math or reading), and express the comparison for the group as a percentage of the statewide mean. For example, the mean 5th grade math scale for white students in the Pittsburgh Public Schools in school year 2006-7 was 1468.81, and the statewide mean for all 5th grade students was 1427.57. The ratio of the two is 103%, and is displayed below in the bar chart.
